
This post will be about investigating the efficacy of contango as a volatility trading signal.
For those that trade volatility (like me), a term you may see that’s somewhat ubiquitous is the term “contango”. What does this term mean?
Well, simple: it just means the ratio of the second month of VIX futures over the first. The idea being is that when the second month of futures is more than the first, that people’s outlook for volatility is greater in the future than it is for the present, and therefore, the futures are “in contango”, which is most of the time.
Furthermore, those that try to find decent volatility trading ideas may have often seen that futures in contango implies that holding a short volatility position will be profitable.
Is this the case?
Well, there’s an easy way to answer that.
First off, refer back to my post on obtaining free futures data from the CBOE.
Using this data, we can obtain our signal (that is, in order to run the code in this post, run the code in that post).
xivSig <- termStructure$C2 > termStructure$C1
Now, let’s get our XIV data (again, big thanks to Mr. Helmuth Vollmeier for so kindly providing it.
require(downloader)
require(quantmod)
require(PerformanceAnalytics)
require(TTR)
require(Quandl)
require(data.table)

download("https://dl.dropboxusercontent.com/s/jk6der1s5lxtcfy/XIVlong.TXT",
         destfile="longXIV.txt")

download("https://dl.dropboxusercontent.com/s/950x55x7jtm9x2q/VXXlong.TXT",
         destfile="longVXX.txt") #requires downloader package

xiv <- xts(read.zoo("longXIV.txt", format="%Y-%m-%d", sep=",", header=TRUE))
xivRets <- Return.calculate(Cl(xiv))
Now, here’s how this works: as the CBOE doesn’t update its settles until around 9:45 AM EST on the day after (EG a Tuesday’s settle data won’t release until Wednesday at 9:45 AM EST), we have to enter at close of the day after the signal fires. (For those wondering, my subscription strategy uses this mechanism, giving subscribers ample time to execute throughout the day.)
So, let’s calculate our backtest returns. Here’s a stratStats function to compute some summary statistics.
stratStats <- function(rets) {
  stats <- rbind(table.AnnualizedReturns(rets), maxDrawdown(rets))
  stats[5,] <- stats[1,]/stats[4,]
  stats[6,] <- stats[1,]/UlcerIndex(rets)
  rownames(stats)[4] <- "Worst Drawdown"
  rownames(stats)[5] <- "Calmar Ratio"
  rownames(stats)[6] <- "Ulcer Performance Index"
  return(stats)
}
stratRets <- lag(xivSig, 2) * xivRets
charts.PerformanceSummary(stratRets)
stratStats(stratRets)
With the following results:
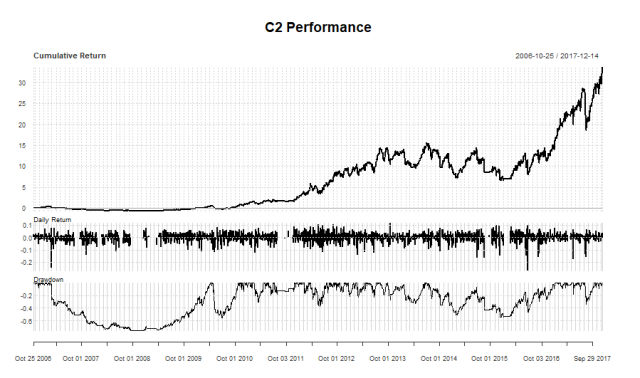
                                 C2
Annualized Return         0.3749000
Annualized Std Dev        0.4995000
Annualized Sharpe (Rf=0%) 0.7505000
Worst Drawdown            0.7491131
Calmar Ratio              0.5004585
Ulcer Performance Index   0.7984454
So, this is obviously a disaster. Visual inspection will show devastating, multi-year drawdowns. Using the table.Drawdowns command, we can view the worst ones.
> table.Drawdowns(stratRets, top = 10)
         From     Trough         To   Depth Length To Trough Recovery
1  2007-02-23 2008-12-15 2010-04-06 -0.7491    785       458      327
2  2010-04-21 2010-06-30 2010-10-25 -0.5550    131        50       81
3  2014-07-07 2015-12-11 2017-01-04 -0.5397    631       364      267
4  2012-03-27 2012-06-01 2012-07-17 -0.3680     78        47       31
5  2017-07-25 2017-08-17 2017-10-16 -0.3427     59        18       41
6  2013-09-27 2014-04-11 2014-06-18 -0.3239    182       136       46
7  2011-02-15 2011-03-16 2011-04-26 -0.3013     49        21       28
8  2013-02-20 2013-03-01 2013-04-23 -0.2298     44         8       36
9  2013-05-20 2013-06-20 2013-07-08 -0.2261     34        23       11
10 2012-12-19 2012-12-28 2013-01-23 -0.2154     23         7       16
So, the top 3 are horrendous, and then anything above 30% is still pretty awful. A couple of those drawdowns lasted multiple years as well, with a massive length to the trough. 458 trading days is nearly two years, and 364 is about one and a half years. Imagine seeing a strategy be consistently on the wrong side of the trade for nearly two years, and when all is said and done, you’ve lost three-fourths of everything in that strategy.
There’s no sugar-coating this: such a strategy can only be called utter trash.
Let’s try one modification: we’ll require both contango (C2 > C1), and that contango be above its 60-day simple moving average, similar to my VXV/VXMT strategy.
contango <- termStructure$C2/termStructure$C1
maContango <- SMA(contango, 60)
xivSig <- contango > 1 & contango > maContango
stratRets <- lag(xivSig, 2) * xivRets
With the results:

> stratStats(stratRets)
                                 C2
Annualized Return         0.4271000
Annualized Std Dev        0.3429000
Annualized Sharpe (Rf=0%) 1.2457000
Worst Drawdown            0.5401002
Calmar Ratio              0.7907792
Ulcer Performance Index   1.7515706
Drawdowns:
> table.Drawdowns(stratRets, top = 10)
         From     Trough         To   Depth Length To Trough Recovery
1  2007-04-17 2008-03-17 2010-01-06 -0.5401    688       232      456
2  2014-12-08 2014-12-31 2015-04-09 -0.2912     84        17       67
3  2017-07-25 2017-09-05 2017-12-08 -0.2610     97        30       67
4  2012-03-27 2012-06-21 2012-07-02 -0.2222     68        61        7
5  2012-07-20 2012-12-06 2013-02-08 -0.2191    139        96       43
6  2015-10-20 2015-11-13 2016-03-16 -0.2084    102        19       83
7  2013-12-27 2014-04-11 2014-05-23 -0.1935    102        73       29
8  2017-03-21 2017-05-17 2017-06-26 -0.1796     68        41       27
9  2012-02-07 2012-02-15 2012-03-12 -0.1717     24         7       17
10 2016-09-08 2016-09-09 2016-12-06 -0.1616     63         2       61
So, a Calmar still safely below 1, an Ulcer Performance Index still in the basement, a maximum drawdown that’s long past the point that people will have abandoned the strategy, and so on.
So, even though it was improved, it’s still safe to say this strategy doesn’t perform too well. Even after the large 2007-2008 drawdown, it still gets some things pretty badly wrong, like being exposed to all of August 2017.
While I think there are applications to contango in volatility investing, I don’t think its use is in generating the long/short volatility signal on its own. Rather, I think other indices and sources of data do a better job of that. Such as the VXV/VXMT, which has since been iterated on to form my subscription strategy.
Thanks for reading.
NOTE: I am currently seeking networking opportunities, long-term projects, and full-time positions related to my skill set. My linkedIn profile can be found here.

Pingback: (Don’t Get) Contangled Up In Noise – Mubashir Qasim
Pingback: Quantocracy's Daily Wrap for 12/21/2017 | Quantocracy
Followed along your previous volatility posts. In testing for robustness, I see cross sectional analysis. Although doesnt seem the best way. Tony Cooper mentioned boot strapping. As far as Im aware, block bootstrapping to simulate many series is one method perhaps. Set a block size, resample and replace the series and stitch it back together. This is in converse to randomly reshuffling 1x data point each time which would lose the structure. Doing so by block retains the structure. However, I read that in order to bootstrap time series, it needs to be iid(independent and identically distributed) which of course if we have autocorrelation in the series is not possible, however differencing the series makes it stationary and removes the auto correlation. I am playing with library(tseries) and running block bootstrap, it outputs many boot strapped series of which cumsum to make a trending series again. However, its limited to only block bootstrapping 1x series at a time. So I opted for coding something out of the packages, and essentially subset by row, save each subset to a list, use sample() to shuffle them, then stitch (rbind) them back together. Do this 1000 times to obtain 1000 block bootstrapped series, then from those boostrapped series, run the strategies. Idea this gives a distribution of results. However, I have obtained pretty disastrous results so far using a block width of 5 and reshuffling. Not sure if my bootstrapped series is even representative, or the strategies im testing are actually failing the robustness test. How has your endavours being with bootstrapping in order to test for robustness?
Anyway – here are two attempts. One using maximum entropy bootstrapping with the meboot R package: https://flare9xblog.wordpress.com/2017/12/30/robustness-testing-volatility-strategy/
The second, block boostrapping, using the np package, b.star command to calculate the block widths: https://flare9xblog.wordpress.com/2017/12/31/custom-resample-and-replace-time-series/