This post will review Kris Boudt’s datacamp course, along with introducing some concepts from it, discuss GARCH, present an application of it to volatility trading strategies, and a somewhat more general review of datacamp.
So, recently, Kris Boudt, one of the highest-ranking individuals pn the open-source R/Finance totem pole (contrary to popular belief, I am not the be-all end-all of coding R in finance…probably just one of the more visible individuals due to not needing to run a trading desk), taught a course on Datacamp on GARCH models.
Naturally, an opportunity to learn from one of the most intelligent individuals in the field in a hand-held course does not come along every day. In fact, on Datacamp, you can find courses from some of the most intelligent individuals in the R/Finance community, such as Joshua Ulrich, Ross Bennett (teaching PortfolioAnalytics, no less), David Matteson, and, well, just about everyone short of Doug Martin and Brian Peterson themselves. That said, most of those courses are rather introductory, but occasionally, you get a course that covers a production-tier library that allows one to do some non-trivial things, such as this course, which covers Alexios Ghalanos’s rugarch library.
Ultimately, the course is definitely good for showing the basics of rugarch. And, given how I blog and use tools, I wholly subscribe to the 80/20 philosophy–essentially that you can get pretty far using basic building blocks in creative ways, or just taking a particular punchline and applying it to some data, and throwing it into a trading strategy to see how it does.
But before we do that, let’s discuss what GARCH is.
While I’ll save the Greek notation for those that feel inclined to do a google search, here’s the acronym:
Generalized Auto-Regressive Conditional Heteroskedasticity
What it means:
Generalized: a more general form of the
Auto-Regressive: past values are used as inputs to predict future values.
Conditional: the current value differs given a past value.
Heteroskedasticity: varying volatility. That is, consider the VIX. It isn’t one constant level, such as 20. It varies with respect to time.
Or, to summarize: “use past volatility to predict future volatility because it changes over time.”
Now, there are some things that we know from empirical observation about looking at volatility in financial time series–namely that volatility tends to cluster–high vol is followed by high vol, and vice versa. That is, you don’t just have one-off huge moves one day, then calm moves like nothing ever happened. Also, volatility tends to revert over longer periods of time. That is, VIX doesn’t stay elevated for protracted periods of time, so more often than not, betting on its abatement can make some money, (assuming the timing is correct.)
Now, in the case of finance, which birthed the original GARCH, 3 individuals (Glosten-Jagannathan-Runkle) extended the model to take into account the fact that volatility in an asset spikes in the face of negative returns. That is, when did the VIX reach its heights? In the biggest of bear markets in the financial crisis. So, there’s an asymmetry in the face of positive and negative returns. This is called the GJR-GARCH model.
Now, here’s where the utility of the rugarch package comes in–rather than needing to reprogram every piece of math, Alexios Ghalanos has undertaken that effort for the good of everyone else, and implemented a whole multitude of prepackaged GARCH models that allow the end user to simply pick the type of GARCH model that best fits the assumptions the end user thinks best apply to the data at hand.
So, here’s the how-to.
First off, we’re going to get data for SPY from Yahoo finance, then specify our GARCH model.
The GARCH model has three components–the mean model–that is, assumptions about the ARMA (basic ARMA time series nature of the returns, in this case I just assumed an AR(1)), a variance model–which is the part in which you specify the type of GARCH model, along with variance targeting (which essentially forces an assumption of some amount of mean reversion, and something which I had to use to actually get the GARCH model to converge in all cases), and lastly, the distribution model of the returns. In many models, there’s some in-built assumption of normality. In rugarch, however, you can relax that assumption by specifying something such as “std” — that is, the Student T Distribution, or in this case, “sstd”–Skewed Student T Distribution. And when one thinks about the S&P 500 returns, a skewed student T distribution seems most reasonable–positive returns usually arise as a large collection of small gains, but losses occur in large chunks, so we want a distribution that can capture this property if the need arises.
<pre class="wp-block-syntaxhighlighter-code brush: plain; notranslate">
require(rugarch)
require(quantmod)
require(TTR)
require(PerformanceAnalytics)

# get SPY data from Yahoo
getSymbols("SPY", from = '1990-01-01')

spyRets = na.omit(Return.calculate(Ad(SPY)))

# GJR garch with AR1 innovations under a skewed student T distribution for returns
gjrSpec = ugarchspec(mean.model = list(armaOrder = c(1,0)),
                      variance.model = list(model = "gjrGARCH",
                                            variance.targeting = TRUE),
                      distribution.model = "sstd")
</pre>
As you can see, with a single function call, the user can specify a very extensive model encapsulating assumptions about both the returns and the model which governs their variance. Once the model is specified,it’s equally simple to use it to create a rolling out-of-sample prediction–that is, just plug your data in, and after some burn-in period, you start to get predictions for a variety of metrics. Here’s the code to do that.
<pre class="wp-block-syntaxhighlighter-code brush: plain; notranslate">
# Use rolling window of 504 days, refitting the model every 22 trading days
t1 = Sys.time()
garchroll = ugarchroll(gjrSpec, data = spyRets,
n.start = 504, refit.window = "moving", refit.every = 22)
t2 = Sys.time()
print(t2-t1)

# convert predictions to data frame
garchroll = as.data.frame(garchroll)
</pre>
In this case, I use a rolling 504 day window that refits every 22 days(approximately 1 trading month). To note, if the window is too short,you may run into fail-to-converge instances, which would disallow converting the predictions to a data frame. The rolling predictions take about four minutes to run on the server instance I use, so refitting every single day is most likely not advised.
Here’s how the predictions look like:
<pre class="wp-block-syntaxhighlighter-code brush: plain; notranslate">
head(garchroll)
                      Mu       Sigma      Skew    Shape Shape(GIG)      Realized
1995-01-30  6.635618e-06 0.005554050 0.9456084 4.116495          0 -0.0043100611
1995-01-31  4.946798e-04 0.005635425 0.9456084 4.116495          0  0.0039964165
1995-02-01  6.565350e-06 0.005592726 0.9456084 4.116495          0 -0.0003310769
1995-02-02  2.608623e-04 0.005555935 0.9456084 4.116495          0  0.0059735255
1995-02-03 -1.096157e-04 0.005522957 0.9456084 4.116495          0  0.0141870212
1995-02-06 -5.922663e-04 0.005494048 0.9456084 4.116495          0  0.0042281655

</pre>
The salient quantity here is the Sigma quantity–that is, the prediction for daily volatility. This is the quantity that we want to compare against the VIX.
So the strategy we’re going to be investigating is essentially what I’ve seen referred to as VRP–the Volatility Risk Premium in Tony Cooper’s seminal paper, Easy Volatility Investing.
The idea of the VRP is that we compare some measure of realized volatility (EG running standard deviation, GARCH predictions from past data) to the VIX, which is an implied volatility (so, purely forward looking). The idea is that when realized volatility (past/current measured) is greater than future volatility, people are in a panic. Similarly, when implied volatility is greater than realized volatility, things are as they should be, and it should be feasible to harvest the volatility risk premium by shorting volatility (analogous to selling insurance).
The instruments we’ll be using for this are ZIV and VXZ. ZIV because SVXY is no longer supported on InteractiveBrokers or RobinHood, and then VXZ is its long volatility counterpart.
We’ll be using close-to-close returns; that is, get the signal on Monday morning, and transact on Monday’s close, rather than observe data on Friday’s close, and transact around that time period as well(also known as magical thinking, according to Brian Peterson).
getSymbols('^VIX', from = '1990-01-01')

# convert GARCH sigma predictions to same scale as the VIX by annualizing, multiplying by 100
garchPreds = xts(garchroll$Sigma * sqrt(252) * 100, order.by=as.Date(rownames(garchroll)))
diff = garchPreds - Ad(VIX)

require(downloader)

download('https://www.dropbox.com/s/y3cg6d3vwtkwtqx/VXZlong.TXT?raw=1', destfile='VXZlong.txt')
download('https://www.dropbox.com/s/jk3ortdyru4sg4n/ZIVlong.TXT?raw=1', destfile='ZIVlong.txt')

ziv = xts(read.zoo('ZIVlong.txt', format='%Y-%m-%d', sep = ',', header=TRUE))
vxz = xts(read.zoo('VXZlong.txt', format = '%Y-%m-%d', sep = ',', header = TRUE))

zivRets = na.omit(Return.calculate(Cl(ziv)))
vxzRets = na.omit(Return.calculate(Cl(vxz)))
vxzRets['2014-08-05'] = .045

zivSig = diff < 0
vxzSig = diff > 0

garchOut = lag(zivSig, 2) * zivRets + lag(vxzSig, 2) * vxzRets

histSpy = runSD(spyRets, n = 21, sample = FALSE) * sqrt(252) * 100
spyDiff = histSpy - Ad(VIX)

zivSig = spyDiff < 0
zivSig = spyDiff > 0

spyOut = lag(zivSig, 2) * zivRets + lag(vxzSig, 2) * vxzRets

avg = (garchOut + spyOut)/2
compare = na.omit(cbind(garchOut, spyOut, avg))
colnames(compare) = c("gjrGARCH", "histVol", "avg")
With the following output:
<pre class="wp-block-syntaxhighlighter-code brush: plain; notranslate">
stratStats <- function(rets) {
  stats <- rbind(table.AnnualizedReturns(rets), maxDrawdown(rets))
  stats[5,] = stats[1,]/stats[4,]
  stats[6,] = stats[1,]/UlcerIndex(rets)
  rownames(stats)[4] = "Worst Drawdown"
  rownames(stats)[5] = "Calmar Ratio"
  rownames(stats)[6] = "Ulcer Performance Index"
  return(stats)
}

charts.PerformanceSummary(compare)
stratStats(compare)

> stratStats(compare)
                           gjrGARCH   histVol       avg
Annualized Return         0.2195000 0.2186000 0.2303000
Annualized Std Dev        0.2936000 0.2947000 0.2614000
Annualized Sharpe (Rf=0%) 0.7477000 0.7419000 0.8809000
Worst Drawdown            0.4310669 0.5635507 0.4271594
Calmar Ratio              0.5092017 0.3878977 0.5391429
Ulcer Performance Index   1.3563017 1.0203611 1.5208926


</pre>

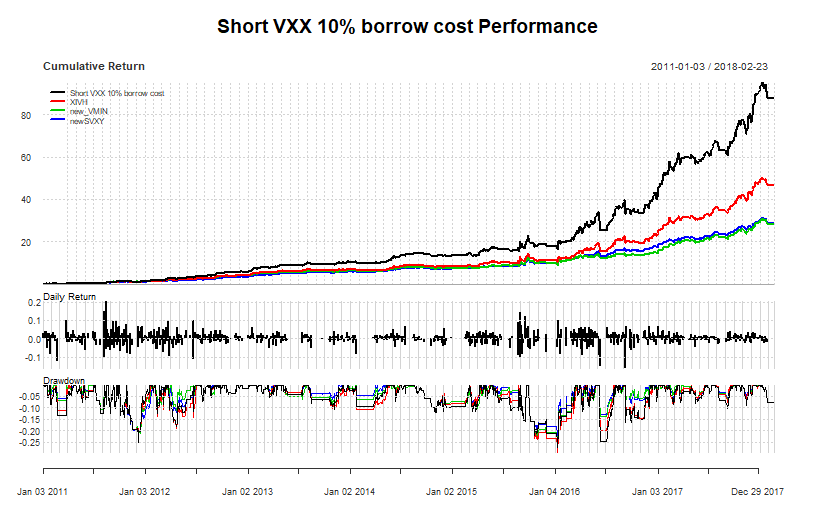
So, to comment on this strategy: this is definitely not something you will take and trade out of the box. Both variants of this strategy, when forced to choose a side, walk straight into the Feb 5 volatility explosion. Luckily, switching between ZIV and VXZ keeps the account from completely exploding in a spectacular failure. To note, both variants of the VRP strategy, GJR Garch and the 22 day rolling realized volatility, suffer their own period of spectacularly large drawdown–the historical volatility in 2007-2008, and currently, though this year has just been miserable for any reasonable volatility strategy, I myself am down 20%, and I’ve seen other strategists down that much as well in their primary strategies.
That said, I do think that over time, and if using the tail-end-of-the-curve instruments such as VXZ and ZIV (now that XIV is gone and SVXY no longer supported on several brokers such as Interactive Brokers and RobinHood), that there are a number of strategies that might be feasible to pass off as a sort of trading analogue to machine learning’s “weak learner”.
That said, I’m not sure how many vastly different types of ways to approach volatility trading there are that make logical sense from an intuitive perspective (that is, “these two quantities have this type of relationship, which should give a consistent edge in trading volatility” rather than “let’s over-optimize these two parameters until we eliminate every drawdown”).
While I’ve written about the VIX3M/VIX6M ratio in the past, which has formed the basis of my proprietary trading strategy, I’d certainly love to investigate other volatility trading ideas out in public. For instance, I’d love to start the volatility trading equivalent of an AllocateSmartly type website–just a compendium of a reasonable suite of volatility trading strategies, track them, charge a subscription fee, and let users customize their own type of strategies. However, the prerequisite for that is that there are a lot of reasonable ways to trade volatility that don’t just walk into tail-end events such as the 2007-2008 transition, Feb 5, and so on.
Furthermore, as some recruiters have told me that I should also cross-post my blog scripts on my Github, I’ll start doing that also, from now on.
***
One last topic: a general review of Datacamp. As some of you may know, I instruct a course on datacamp. But furthermore, I’ve spent quite a bit of time taking courses (particularly in Python) on there as well, thanks to having access by being an instructor.
Generally, here’s the gist of it: Datacamp is a terrific resource for getting your feet wet and getting a basic overview of what technologies are out there. Generally, courses follow a “few minutes of lecture, do exercises using the exact same syntax you saw in the lecture”, with a lot of the skeleton already written for you, so you don’t wind up endlessly guessing. Generally, my procedure will be: “try to complete the exercise, and if I fail, go back and look at the slides to find an analogous block of code, change some names, and fill in”.
Ultimately, if the world of data science, machine learning, and some quantitative finance is completely new to you–if you’re the kind of person that reads my blog, and completely glosses past the code: *this* is the resource for you, and I recommend it wholeheartedly. You’ll take some courses that give you a general tour of what data scientists, and occasionally, quants, do. And in some cases, you may have a professor in a fairly advanced field, like Kris Boudt, teach a fairly advanced topic, like the state-of-the art rugarch package (this *is* an industry-used package, and is actively maintained by Alexios Ghalanos, an economist at Amazon, so it’s far more than a pedagogical tool).
That said, for someone like me, who’s trying to port his career-capable R skills to Python to land a job (my last contract ended recently, so I am formally searching for a new role), Datacamp doesn’t *quite* do the trick–just yet. While there is a large catalog of courses, it does feel like there’s a lot of breadth, though not sure how much depth in terms of getting proficient enough to land interviews on the sole merits of DataCamp course completions. While there are Python course tracks (EG python developer, which I completed, and Python data analyst, which I also completed), I’m not sure they’re sufficient in terms of “this track was developed with partnership in industry–complete this capstone course, and we have industry partners willing to interview you”.
Also, from what I’ve seen of quantitative finance taught in Python, and having to rebuild all functions from numpy/pandas, I am puzzled as to how people do quantitative finance in Python without libraries like PerformanceAnalytics, rugarch, quantstrat, PortfolioAnalytics, and so on. Those libraries make expressing and analyzing investment ideas far more efficient, and removes a great chance of making something like an off-by-one error (also known as look-ahead bias in trading). So far, I haven’t seen the Python end of Datacamp dive deep into quantitative finance, and I hope that changes in the near future.
So, as a summary, I think this is a fantastic site for code-illiterate individuals to get their hands dirty and their feet wet with some coding, but I think the opportunity to create an economic, democratized, interest to career a-la-carte, self-paced experience is still very much there for the taking. And given the quality of instructors that Datacamp has worked with in the past (David Matteson–*the* regime change expert, I think–along with many other experts), I think Datacamp has a terrific opportunity to capitalize here.
So, if you’re the kind of person who glosses past the code: don’t gloss anymore. You can now take courses to gain an understanding of what my code does, and ask questions about it.
***
Thanks for reading.
NOTE: I am currently looking for networking opportunities and full-time roles related to my skill set. Feel free to download my resume or contact me on LinkedIn.


 CSV:
CSV: